
Expert in Camera Module Solution
Expert in Camera Module Solution
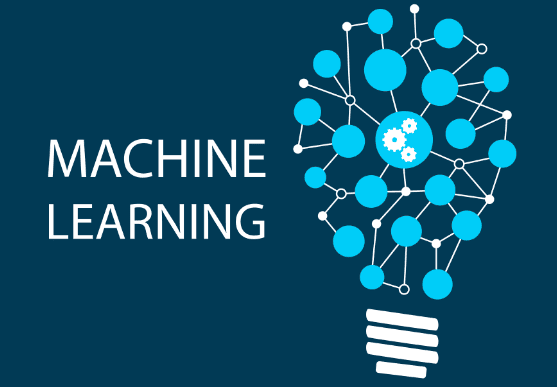
It is no doubt that the sub-field of machine learning / artificial intelligence has increasingly gained more popularity in the past couple of years. As Big Data is the hottest trend in the tech industry at the moment, machine learning is incredibly powerful to make predictions or calculated suggestions based on large amounts of data. Some of the most common examples of machine learning are Netflix’s algorithms to make movie suggestions based on movies you have watched in the past or Amazon’s algorithms that recommend books based on books you have bought before.
Machine learning algorithms can be divided into 3 broad categories — supervised learning, unsupervised learning, and reinforcement learning. Supervised learning is useful in cases where a property (label) is available for a certain dataset (training set), but is missing and needs to be predicted for other instances. Unsupervised learning is useful in cases where the challenge is to discover implicit relationships in a given unlabeled dataset (items are not pre-assigned). Reinforcement learning falls between these 2 extremes — there is some form of feedback available for each predictive step or action, but no precise label or error message. Since this is an intro class, I didn’t learn about reinforcement learning, but I hope that 10 algorithms on supervised and unsupervised learning will be enough to keep you interested.
Supervised Learning
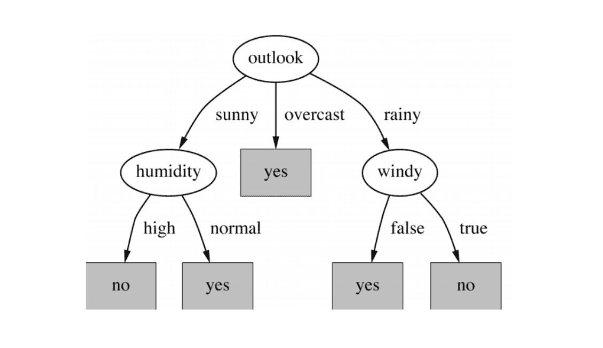
1. Decision Trees: A decision tree is a decision support tool that uses a tree-like graph or model of decisions and their possible consequences, including chance-event outcomes, resource costs, and utility. Take a look at the image to get a sense of how it looks like.
From a business decision point of view, a decision tree is the minimum number of yes/no questions that one has to ask, to assess the probability of making a correct decision, most of the time. As a method, it allows you to approach the problem in a structured and systematic way to arrive at a logical conclusion.
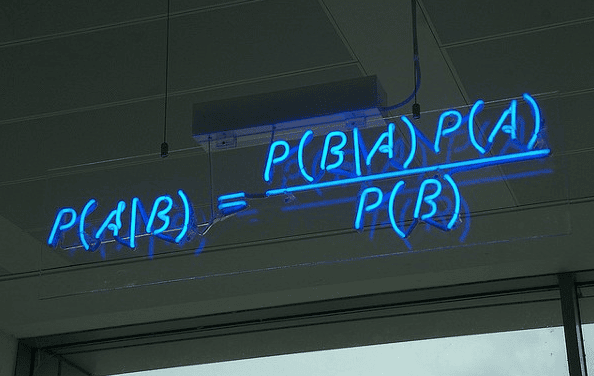
2. Naive Bayes Classification: Naive Bayes classifiers are a family of simple probabilistic classifiers based on applying Bayes’ theorem with strong (naive) independence assumptions between the features. The featured image is the equation — with P(A|B) is posterior probability, P(B|A) is likelihood, P(A) is class prior probability, and P(B) is predictor prior probability.
Some of real world examples are:
-To mark an email as spam or not spam
-Classify a news article about technology, politics, or sports
-Check a piece of text expressing positive emotions, or negative emotions?
-Used for face recognition software.
3. Ordinary Least Squares Regression: If you know statistics, you probably have heard of linear regression before. Least squares is a method for performing linear regression. You can think of linear regression as the task of fitting a straight line through a set of points. There are multiple possible strategies to do this, and “ordinary least squares” strategy go like this — You can draw a line, and then for each of the data points, measure the vertical distance between the point and the line, and add these up; the fitted line would be the one where this sum of distances is as small as possible.
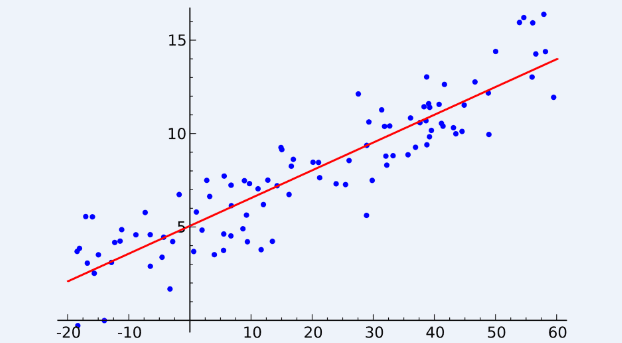
Linear refers the kind of model you are using to fit the data, while least squares refers to the kind of error metric you are minimizing over.
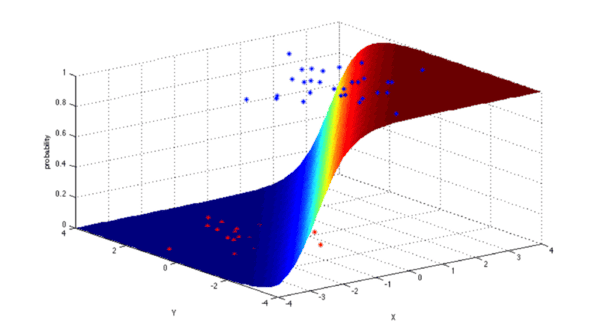
4. Logistic Regression: Logistic regression is a powerful statistical way of modeling a binomial outcome with one or more explanatory variables. It measures the relationship between the categorical dependent variable and one or more independent variables by estimating probabilities using a logistic function, which is the cumulative logistic distribution.
In general, regressions can be used in real-world applications such as:
-Credit Scoring
-Measuring the success rates of marketing campaigns
-Predicting the revenues of a certain product
-Is there going to be an earthquake on a particular day?
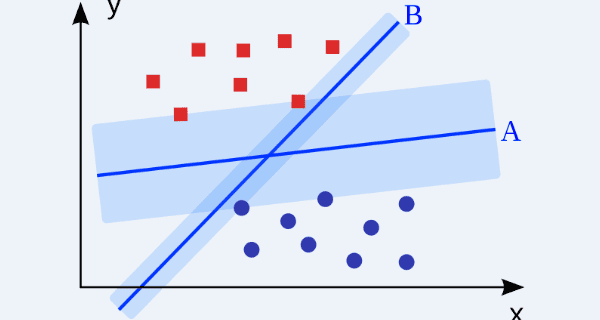
5. Support Vector Machines: SVM is binary classification algorithm. Given a set of points of 2 types in N dimensional place, SVM generates a (N — 1) dimensional hyperplane to separate those points into 2 groups. Say you have some points of 2 types in a paper which are linearly separable. SVM will find a straight line which separates those points into 2 types and situated as far as possible from all those points.
In terms of scale, some of the biggest problems that have been solved using SVMs (with suitably modified implementations) are display advertising, human splice site recognition, image-based gender detection, large-scale image classification...
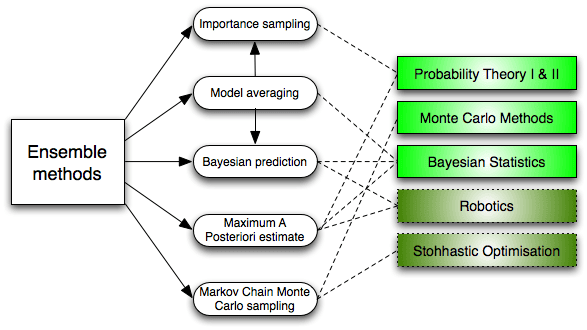
6. Ensemble Methods: Ensemble methods are learning algorithms that construct a set of classifiers and then classify new data points by taking a weighted vote of their predictions. The original ensemble method is Bayesian averaging, but more recent algorithms include error-correcting output coding, bagging, and boosting.
So how do ensemble methods work and why are they superior to individual models?
1. They average out biases: If you average a bunch of democratic-leaning polls and republican-leaning polls together, you will get an average something that isn’t leaning either way.
2. They reduce the variance: The aggregate opinion of a bunch of models is less noisy than the single opinion of one of the models. In finance, this is called diversification — a mixed portfolio of many stocks will be much less variable than just one of the stocks alone. This is why your models will be better with more data points rather than fewer.
3. They are unlikely to over-fit: If you have individual models that didn’t over-fit, and you are combining the predictions from each model in a simple way (average, weighted average, logistic regression), then there’s no room for over-fitting.
Unsupervised Learning
7. Clustering Algorithms: Clustering is the task of grouping a set of objects such that objects in the same group (cluster) are more similar to each other than to those in other groups.
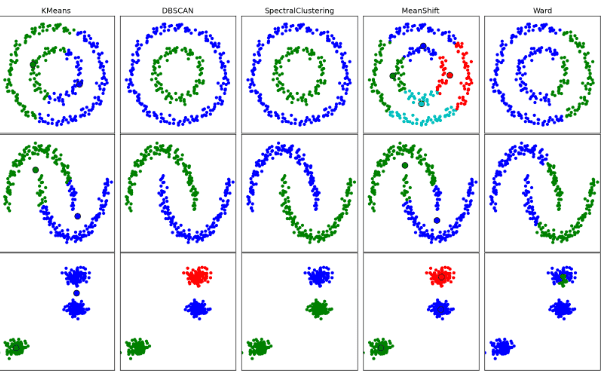
Every clustering algorithm is different, and here are a couple of them:
-Centroid-based algorithms
-Connectivity-based algorithms
-Density-based algorithms
-Probabilistic
-Dimensionality Reduction
-Neural networks / Deep Learning
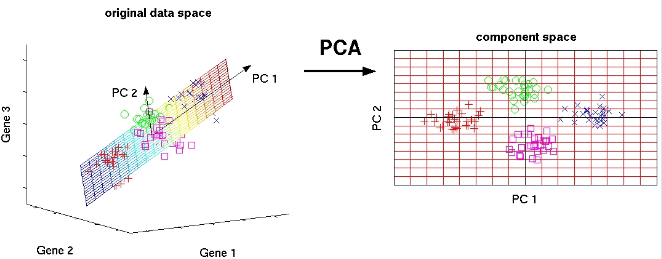
8. Principal Component Analysis: PCA is a statistical procedure that uses an orthogonal transformation to convert a set of observations of possibly correlated variables into a set of values of linearly uncorrelated variables called principal components.
Some of the applications of PCA include compression, simplifying data for easier learning, visualization. Notice that domain knowledge is very important while choosing whether to go forward with PCA or not. It is not suitable in cases where data is noisy (all the components of PCA have quite a high variance).
9. Singular Value Decomposition: In linear algebra, SVD is a factorization of a real complex matrix. For a given m * n matrix M, there exists a decomposition such that M = UΣV, where U and V are unitary matrices and Σ is a diagonal matrix.
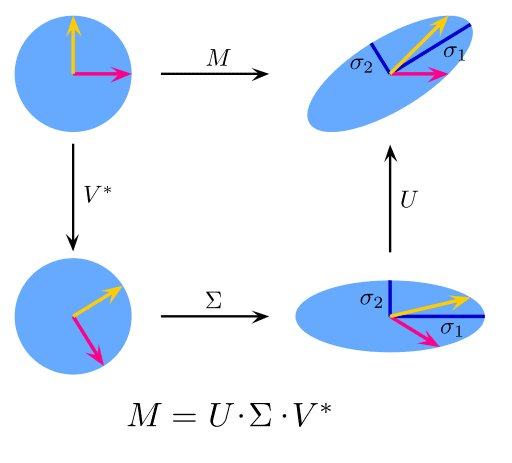
PCA is actually a simple application of SVD. In computer vision, the 1st face recognition algorithms used PCA and SVD in order to represent faces as a linear combination of “eigenfaces”, do dimensionality reduction, and then match faces to identities via simple methods; although modern methods are much more sophisticated, many still depend on similar techniques.
10. Independent Component Analysis: ICA is a statistical technique for revealing hidden factors that underlie sets of random variables, measurements, or signals. ICA defines a generative model for the observed multivariate data, which is typically given as a large database of samples. In the model, the data variables are assumed to be linear mixtures of some unknown latent variables, and the mixing system is also unknown. The latent variables are assumed non-gaussian and mutually independent, and they are called independent components of the observed data.
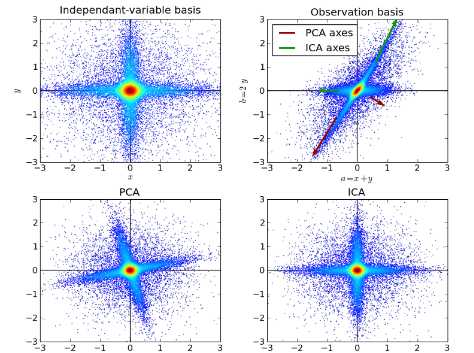
ICA is related to PCA, but it is a much more powerful technique that is capable of finding the underlying factors of sources when these classic methods fail completely. Its applications include digital images, document databases, economic indicators and psychometric measurements.
Now go forth and wield your understanding of algorithms to create machine learning applications that make better experiences for people everywhere.
Key words: Algorithms, Machine Learning, Supervised Learning, Unsupervised Learning, artificial intelligence
Author: James Le, Machine Learning Engineer
And you can learn more about James Le at this link: https://www.kdnuggets.com/author/james-le
The original article is from https://www.kdnuggets.com/2016/08/10-algorithms-machine-learning-engineers.html
